Diagram

Platform Decomposition Diagram

Mandatory
Yes
The Platform Decomposition diagram depicts the technology platform that supports the operations of the Information Systems Architecture. The diagram covers all aspects of the infrastructure platform and provides an overview of the enterprise's technology platform. The diagram can be expanded to map the technology platform to appropriate application components within a specific functional or process area. This diagram may show specification details, such as product versions, number of CPUs, etc.
Environments and Locations Diagram

Mandatory
Yes
Environments and Locations Diagram The Environments and Locations diagram depicts which locations host which applications, identifies what technologies and/or applications are used at which locations, and finally identifies the locations from which business users typically interact with the applications. This diagram should also show the existence and location of different deployment environments, including non-production environments, such as development and pre-production.

Networked Computing/Hardware Diagram

Mandatory
No
Starting with the transformation to client-server systems from mainframes and later with the advent of e-Business and J2EE, large enterprises moved predominantly into a highly network-based distributed network computing environment with firewalls and demilitarized zones. Currently, most of the applications have a web front-end and, looking at the deployment architecture of these applications, it is very common to find three distinct layers in the network landscape; namely a web presentation layer, a business logic or application layer, and a back-end data store layer.

Application Use-Case Diagram

Mandatory
No
An Application Use-Case diagram displays the relationships between consumers and providers of application services. Application services are consumed by actors or other application services and the Application Use-Case diagram provides added richness in describing application functionality by illustrating how and when that functionality is used. The purpose of the Application Use-Case diagram is to help to describe and validate the interaction between actors and their roles with applications.

Application Migration Diagram

Mandatory
No
The Application Migration diagram identifies application migration from baseline to target application components. It enables a more accurate estimation of migration costs by showing precisely which applications and interfaces need to be mapped between migration stages. It would identify temporary applications, staging areas, and the infrastructure required to support migrations (for example, parallel run environments, etc).

Software Engineering Diagram

Mandatory
No
The Software Engineering diagram breaks applications into packages, modules, services, and operations from a development perspective. It enables more detailed impact analysis when planning migration stages, and analyzing opportunities and solutions. It is ideal for application development teams and application management teams when managing complex development environments.

Enterprise Manageability Diagram

Mandatory
No
The Enterprise Manageability diagram shows how one or more applications interact with application and technology components that support the operational management of a solution. This diagram is really a filter on the Application Communication diagram, specifically for enterprise management class software. Analysis can reveal duplication and gaps, and opportunities in the IT service management operation of an organization.

Logical Data Diagram

Mandatory
Yes
The key purpose of the Logical Data diagram is to show logical views of the relationships between critical data entities within the enterprise. This diagram is developed to address the concerns of: Application developers Database designers

Functional Decomposition Diagram

Mandatory
Yes
Security related?
No
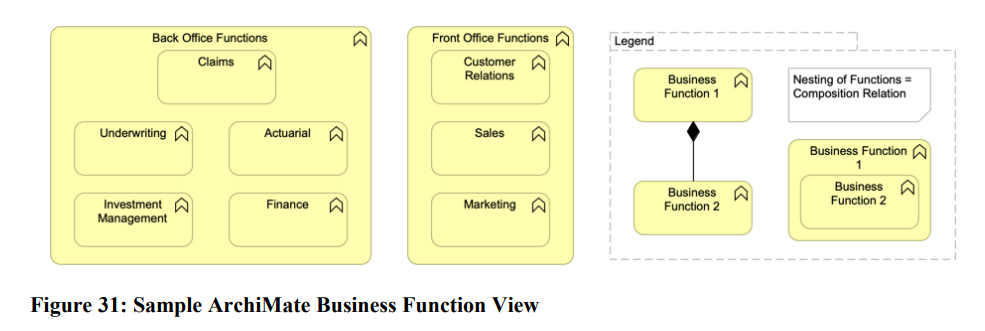
The purpose of the Functional Decomposition diagram is to show on a single page the capabilities of an organization that are relevant to the consideration of an architecture. By examining the capabilities of an organization from a functional perspective, it is possible to quickly develop models of what the organization does without being dragged into extended debate on how the organization does it. Once a basic Functional Decomposition diagram has been developed, it becomes possible to layer heat maps on top of this diagram to show scope and decisions.
example view

Conceptual Data Diagram

Mandatory
Yes
Security related?
Yes
The key purpose of the Conceptual Data diagram/Information Structure View is to depict the relationships between critical data entities within the enterprise. This diagram is developed to address the concerns of business stakeholders. Refer to DoE Conceptual Information Asset Model (16/489129) and develop project specific view. This view also needs to be included as part of the Information Security Assessment (ISA)